|
TRIMS allows you to produce
detailed and informative budget reports for tracking and
planning purposes. TRIMS Management Reports show you where
every dollar and labor hour was spent.
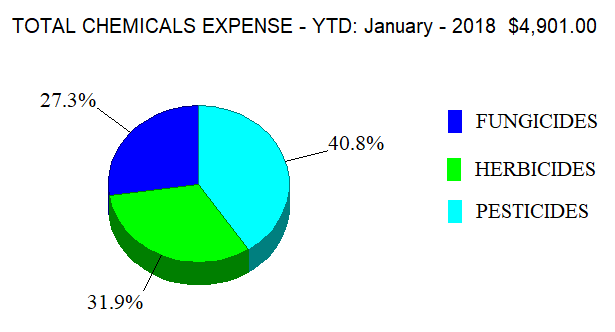
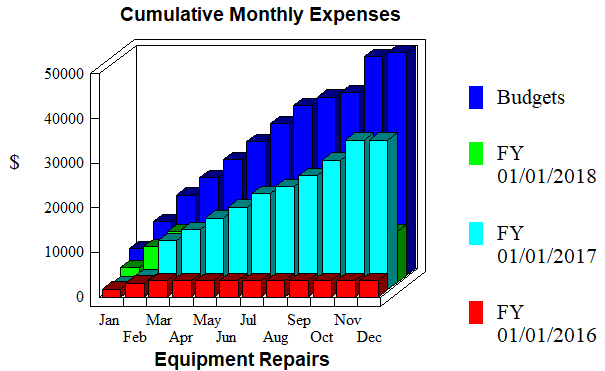
You can produce bar graphs, pie charts and line graphs to
illustrate your budget progress, budget variance and previous
year comparisons. TRIMS stores three (3) years of budget &
expense history information.
Use
TRIMS Cloud Computing to view Pie
Charts & Bar Graphs via an iPhone, iPad, Android Device or
any web browser.
Export many Budget/Expense Reports directly into Excel for
further customization.
Budget/Expense Management Reports & Graphs Include:
 Chart of Accounts
 |
Annual Expenses |
|
Monthly Expenses |
Transaction Register |
|
Budget Variance |
Departmental Budgets |
|
Budget Progress |
Expense Line Graphs |
|
Previous Year Comparisons |
Budget/Expense Pie Charts |
|